Welcome back to the drug discovery series! In this post, we journey through target validation and assay development and validation for compound screening!
Target Validation
As mentioned earlier in the series, most small molecule drugs function by modulating the activity of their particular target protein(s). Targets may be identified in a number of ways, for example, through studying disease pathophysiology to find disease-relevant pathways, or using genome and transcriptome analysis to identify proteins that are differentially expressed and/or aberrantly translated during disease. The early stages of any drug discovery effort must include extensive target validation, ideally through a broad combination of in vitro and in vivo (animal models), cellular and ‘omics’ approaches (1).
Compound Screening – Assay Design and Optimization
Compound screening is often carried out on a large scale, where millions of library compounds are screened. Screening on this scale is known as high throughput screening (HTS). If less than millions of compounds are deployed, one should consider low-to-medium throughput or collections of compounds. During screening, compounds are assayed for interactions with the target, typically in 96-, 384-, or 1536-well format. The nature of the interaction that is assayed between a compound and the target may be inhibition, activation, modulating, or binding.
The specific assays used for compound screening in any drug discovery program are target-dependent (assuming a non-phenotypic organotypic or whole genome approach), and also depend on desired characteristics such as assay sensitivity and robustness, requirement for and ease of automation, and cost. Homogeneous resources are highly desirable (but not often relevant for human disease phenotypes) because of their simple ‘mix and read’ format, thus reducing assay time, pipetting, and likely cost. Where target specificity is a concern, for example, when targeting a fungal protein that has a closely related human counterpart, counter-screening assays may also be set up in a similar fashion to allow the identification of compounds that only modulate the targeted non-human protein.
Once decisions surrounding assay format and setup are in place, the assay(s) undergoes extensive evaluation for sensitivity, specificity, and robustness. All steps, including the assaying procedure itself, consumables used and the detection system (and associated hardware and software) must be optimized to ensure consistency in assay results. Considerations for optimizing the assay procedure include: target availability and batch-to-batch variation (whether using a native or recombinantly expressed protein), reaction components and conditions, studying enzyme kinetics to find the linear range, and testing the targets response to known inhibitors, activators or binders. Including a known reference compound that modulates the target provides a useful reference control that can be included in every assay run, and on every assay plate, to ensure that the assay is working as expected every time.
Hunting for Hits – Assay Validation
The entire optimization process described above is an essential part of assay validation. But designing and optimizing the assay setup is not enough. The ultimate goal of developing HTS assays is to be able to reliably and quickly identify library compounds that appear to have the desired effects on the target, so called ‘hits’, while eliminating compounds that are not worth pursuing. Since test compounds often come from huge chemical libraries consisting of millions of compounds, the sorting of hits from ‘non-hits’ needs to be fast and reliable.
To identify hits with confidence, only small variations in signal measurements (i.e. assay readout) between repeat runs of the same library compound can be tolerated. The coefficiency of variation (CV) is often used to express the precision and reproducibility of an assay. This is a statistical measure of how the data points in a data set are dispersed around the mean, and is calculated as the standard deviation of a set of measurements i.e. assay results divided by the mean of the same data set. Other useful parameters include the signal to blank (S/B) and signal to noise (S/N) ratios – these are used to determine the dynamic range of an assay. Although a useful quality parameter for assay reproducibility, the CV has some limitations. It doesn’t account for the dynamic range of the signal, or the variability in the test compound and reference control measurements. The dynamic range of the signal is the difference between the background and the maximum signal. For example, in a cell-based assay to screen new compounds for antibiotic activity where the readout is turbidity (as a measure of bacterial growth), the background signal would be measured in wells without inoculum, while the maximum signal would be expected in wells inoculated with bacteria but no compound (i.e. solvent only controls).
Hit or Not? Z factor and Z’ Prime
The Z-factor is a measure of statistical effect size, and is more reliable measurement of assay quality than any of the parameters described above. Although its use is not restricted to HTS, it is most commonly referred to as Z-prime or Z’ in drug discovery assays. In simple terms, the Z’ score from any particular assay allows the researcher to evaluate whether the response observed in that assay is large enough to warrant further attention.
The Z’ equation takes 4 parameters into account: the means and the standard deviations (SD) of the positive and the negative controls. The controls are equivalent to the maximum and background signal measurements from the assay, and all measurements are normally made in triplicate during assay validation. The equation looks like this:
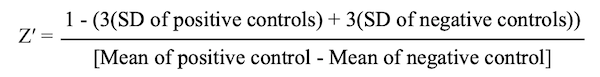
where SD is the standard deviation, and the maximum possible value for Z’ = 1. The closer to 1, the better the Z’ score (as outlined in the table below). Looking at the equation, it is clear that the best Z’ scores will emerge when the means of both controls are very different to each other and the standard deviations of both controls are as low as possible. The derivation of Z’ can be found in Zhang et al. (2).
It is important to note that while Z’ is used to validate any given assay before it is implemented in HTS, Z’ should also calculated in every single assay run on every single assay plate through the screening and hit identification process, including any counter-screening assays that may be involved. This reduces the risks of following up on false-positive hits and missing out on promising hits, as compounds tested on a plate that gives a poor Z’ score should be retested before any conclusions about their potential are made.
How Should You Interpret the Z’ Score?
| Z’ Score | Interpretation |
| 1 | The ideal (but rarely encountered) Z’ score is 1. |
| 0.5 – 1 | For biochemical assays, a Z’ score between 0.5 and 1 is considered to represent an excellent assay, where the dynamic range is large enough so that signal changes associated with test compounds are likely to represent ‘real’ effects on the target protein. A Z’ score of 0.4 and 1 is usually considered acceptable in cell-based assays. |
| 0 – 0-5 | Z’ scores between 0 and 0.5 (or between 0 and 0.4 for cell-based assays) are considered marginal, and should prompt a reexamination of the assay setup in an attempt to improve the Z’ score. |
| ≤ 1 | Z’ scores of 0 and below indicate that the assay is useless because there is too much overlap between the positive and negative controls. |
Stay tuned for our next post, where we take a look at the considerations involved in starting a drug development program from presumed disease targets.
References
- J. P. Hughes, S. Rees, S. B. Kalindjian, K. L. Philpott, Principles of early drug discovery. Br J Pharmacol 162, 1239-1249 (2011).
- J. H. Zhang, T. D. Chung, K. R. Oldenburg, A Simple Statistical Parameter for Use in Evaluation and Validation of High Throughput Screening Assays. J Biomol Screen 4, 67-73 (1999).
Article by Karen O’Hanlon Cohrt PhD. Contact Karen at karen@tempobioscience.com.
Karen O’Hanlon Cohrt is a Science Writer with a PhD in biotechnology from Maynooth University, Ireland (2011). After her PhD, Karen moved to Denmark and held postdoctoral positions in mycology and later in human cell cycle regulation, before moving to the world of drug discovery. Her broad research background provides the technical know-how to support scientists in diverse areas, and this in combination with her passion for writing helps her to keep abreast of exciting research developments as they unfold. Follow Karen on Twitter @KarenOHCohrt. Karen has been a science writer since 2014; you can find her other work on her portfolio.